Measure and improve
Understanding your AI maturity score
In short: The AI maturity dashboard shows your organization’s score and checklist progress across four Moments and five maturity levels.
AI maturity gives you a way to see what your organization has configured and where more work remains. The dashboard breaks progress into specific tasks, so you can inspect what is complete and choose which areas to work on next.
How to read the dashboard
The AI maturity dashboard is a grid with four columns for Moments and five rows for maturity levels. Each cell represents one Moment at one maturity level, and the top-left corner displays the total AI maturity score across the grid.
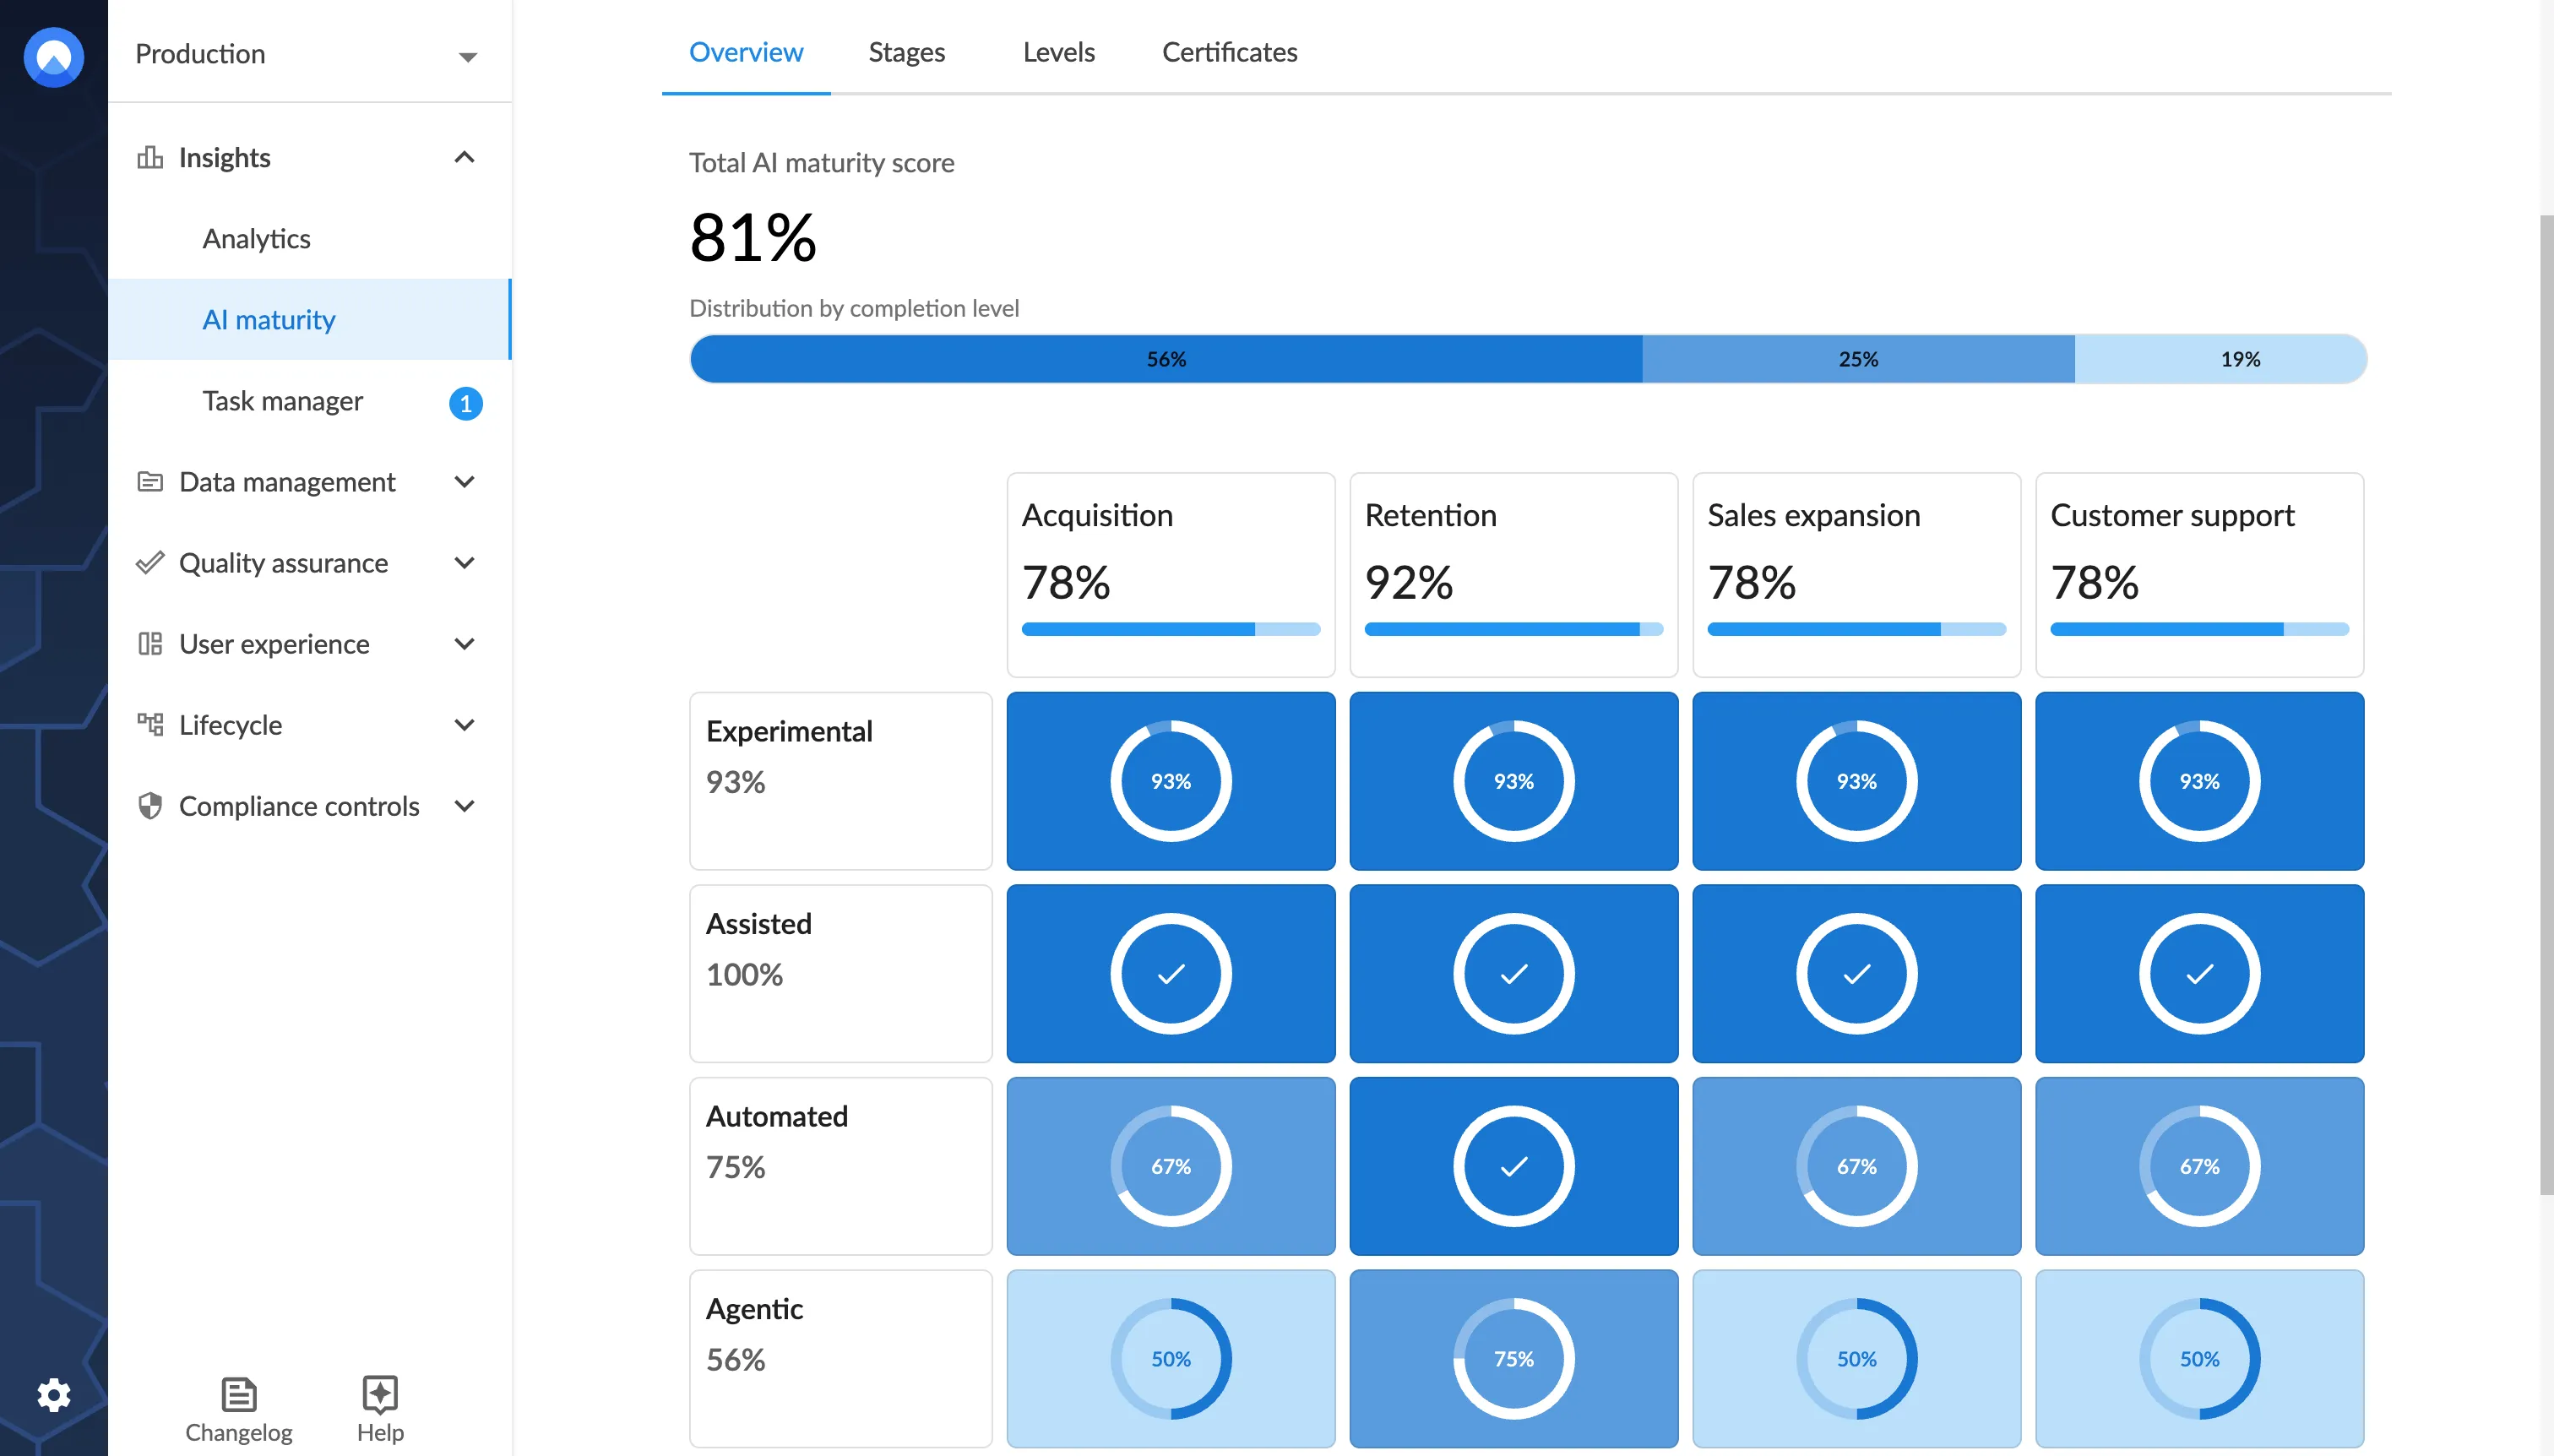
A cell’s checklist shows the work for that particular combination of Moment and level. Completing every item brings the cell to 100%; a partially complete cell shows its completion percentage as a ring chart.
Review what remains
Click any cell to see which items are complete and which still need attention. The checklist may include connecting a Source, configuring a Procedure, or activating a Signal, depending on the cell.
Each cell has its own checklist, so progress in one does not depend on progress in another. You can work on any cell in any order, making it easier to focus on the areas that matter to your rollout.
Find your score in Insights
Open the AI maturity tab in Insights to review your overall score and the underlying scores for each lifecycle stage and AI level. Use the grid’s checklists to understand what contributes to progress and decide what to do next.
Together, the score and cell-level details provide both a high-level view and a practical list of next steps. Start with any cell, review its checklist, and track progress as you complete the items.